
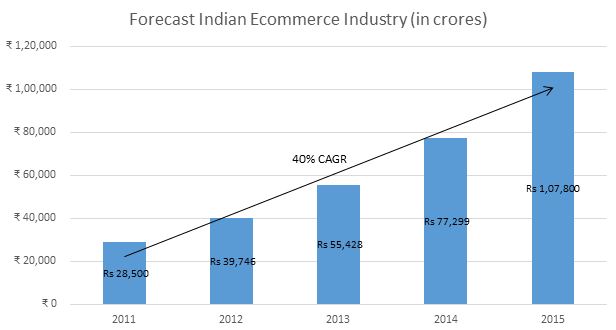
Indian Ecommerce Industry
The Indian Ecommerce industry is estimated to grow at a CAGR of 40% to Rs.1, 07,800 Crores ($18 billion) by 2015 from Rs.28, 500 Crores ($4.75 billion) in 2011. While 87% of the revenues in 2011 are from online travel, it is expected that e-tailing will catchup by 2015. The industry is yet to make big profits but is expected to have high potential which is evident from the huge investments in this industry.
Valuing Ecommerce Companies
The ecommerce space in India is still evolving and companies have limited history. Many of them function at negative operating cashflows and are dependent on investments from venture capital firms. Using traditional valuation methods like DCF Valuation and Relative Valuation remain a challenge in this segment. While each company needs to be examined individually, this reckoner presents a broad guideline of a dual framework to value ecommerce companies with illustrative examples.
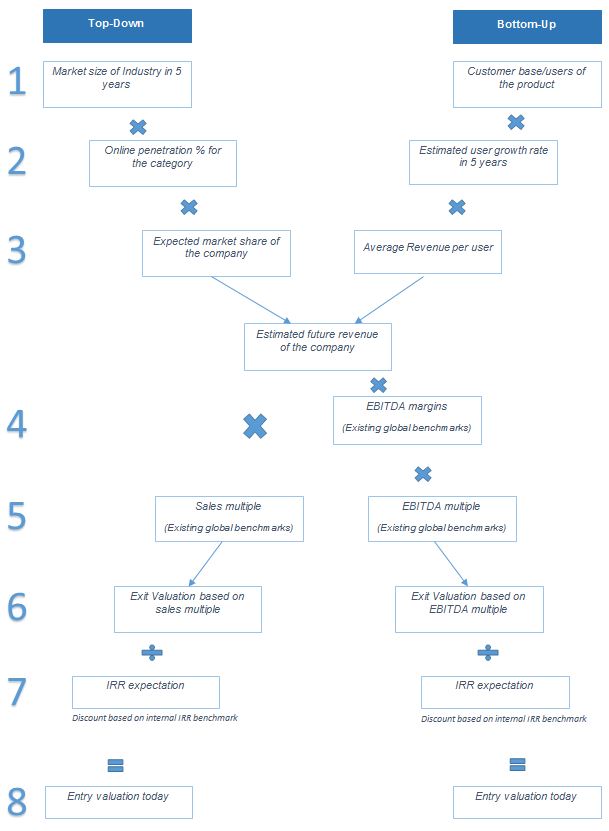
Dual Approach Valuation Framework for Ecommerce Companies
Top-down Approach:
Expected Revenue of the firm in question is estimated using a top down approach, i.e., start from the market size of the industry the company is targeting and multiply the same with the online penetration rate of that category. The total market size is multiplied with expected market share of the company to arrive at a revenue number for the company. This is used to calculate the EBITDA (a measure of profitability) for the firm using EBITDA margins of available global benchmarks. Valuation multiples EV/Sales and EV/EBITDA are used to arrive at the future value of the company. This value can be discounted using the internal benchmark rate of VCs or IRR to arrive at the current valuation of the company.
Bottom-up Approach:
In the bottom-up approach, the company’s user base size, growth and average ticket size are calculated to estimate the revenue of the company in a future year. This approach considers the capacity of the firm and limits the growth to what can be achieved by the firm vs the market. Revenue and EBITDA calculated are used to arrive at the future value of the company. This value can be discounted using the internal benchmark rate of VCs or IRR to arrive at the current valuation of the company.
Examples
Two ecommerce companies have been valued using the dual approach framework. The numbers provided are for illustration purposes only.
Flipkart’s Valuation
Top-down approach based on EBITDA multiple
|
No. |
Steps |
Value |
Comments |
|
1 |
Market Size of Indian Retail Industry in 2015 |
$ 574 Bn |
Source: IBEF |
|
2 |
Online penetration for the category in 2015 |
1% |
Source: AT Kearney |
|
3 |
Expected market share of the player |
20% |
A market leader in US commands a share of 8-20%. Expecting 4-5 big players in the industry after consolidation |
|
4 |
EBITDA Margin |
4.2% |
Considering Amazon.com as a benchmark for Flipkart |
|
5 |
EBITDA Multiple |
25.7x |
From Appendix B |
|
6 |
Exit Valuation in 2015 |
$ 1.22 Bn |
|
|
7 |
IRR Expectation |
25% |
Assuming hurdle rate for VCs |
|
|
Discount Factor |
1.32 |
Calculated as (1+IRR)^Years |
|
8 |
Estimated Valuation in 2013 |
$ 0.93 Bn |
Bottom-up approach based on EBITDA multiple
|
No. |
Steps |
Value |
Comments |
|
1 |
Customer base of Flipkart in 2013 |
96,00,000 |
Source: ET article on Flipkart dated 13th Oct, 2013 |
|
2 |
Expected user growth |
261% |
Assuming 50% drop in growth rate of customer base every year. Refer Appendix A |
|
3 |
Average Revenue per user |
Rs. 2083 |
Assuming the ticket size to remain same as 2013 |
|
4 |
EBITDA Margin |
4.2% |
Considering Amazon.com as benchmark for Flipkart |
|
5 |
EBITDA Multiple |
25.7x |
Refer Appendix B |
|
6 |
Exit Valuation in 2015 |
Rs. 7698 Cr |
|
|
7 |
IRR Expectation |
25% |
Commonly used hurdle rate of VCs |
|
|
Discount Factor |
1.32 |
Calculated as (1+IRR)^Years |
|
8 |
Estimated Valuation in 2013 |
Rs. 5825 Cr |
Valuation range of Flipkart: $926.26 Million to $970.76 Million
Redbus Valuation
Top-down approach based on EBITDA multiple
|
No. |
Steps |
Value |
Comments |
|
1 |
Market Size of Indian Bus ticketing Industry in 2015 |
Rs. 40,000 Cr |
As per survey of ticketgoose.com |
|
2 |
Online penetration for the category |
5.7% |
Research by University of Pennsylvania on Redbus acquisition |
|
3 |
Expected market share of the player |
20.0% |
Assuming a market leader to command 20% of market share |
|
4 |
EBITDA Margin |
10.0% |
Research by University of Pennsylvania on Redbus acquisition |
|
5 |
EBITDA Multiple |
12.9x |
From Appendix C |
|
6 |
Exit Valuation in 2015 |
Rs. 620 Cr |
|
|
7 |
IRR Expectation |
25.0% |
Commonly used hurdle rate of VCs |
|
|
Discount |
1.32 |
Calculated as (1+IRR)^Years |
|
8 |
Estimated Valuation in 2013 |
Rs. 469 Cr |
Bottom-up approach based on EBITDA multiple
|
No. |
Steps |
Value |
Comments |
|
1 |
Customer base of Redbus in 2012 |
20,00,000 |
As per the press release by the company |
|
2 |
Expected user growth (per annum) |
25% |
From the CEO’s talk at Stanford, the bus ticketing industry is growing by 25%. |
|
3 |
Average Revenue per user (in INR) |
1500 |
Assuming average annual revenue per user to be Rs.1500, same as the figures of 2012 |
|
4 |
EBITDA Margin |
10.0% |
Research by University of Pennsylvania |
|
5 |
EBITDA Multiple |
12.9x |
From Appendix C |
|
6 |
Exit Valuation in 2015 |
Rs. 756 Cr |
|
|
7 |
IRR Expectation |
25% |
Commonly used hurdle rate of VCs |
|
|
Discount Factor |
1.32 |
Calculated as (1+IRR)^Years |
|
8 |
Estimated Valuation in 2013 |
Rs. 572 Cr |
Valuation range of Redbus: Rs. 469 Crores to Rs. 572 Crores
Conclusion
While valuing start-ups in reality pose significant challenges, our aim is to provide a logical framework to value such entities with reasonable underlying assumptions. The dual approach described in this report presents a rational method to reach a valuation range for the start-up. However, current valuations provided to the poster boys of the e-commerce industry seems to be higher than fundamentals. Reasons could be lack of high quality companies, multiple investors chasing the same set of companies, and winner takes it all dynamics of platform businesses. General belief in the industry is that the valuations are a couple of years ahead of actual performance of companies.
End notes
Source: Analyst Reports, Company Press Releases, CEO Interviews in media
Conversion Rate: 1 USD = 60 INR
EBITDA: Earnings before Interest, Taxes, Depreciation & Amortization - a measure of company’s profitability
EV: Enterprise Value - a measure of company’s worth
Hurdle Rate: Minimum rate of return expected from a project by a fund manager or an investor
Appendix
A. Flipkart user base projections
|
Year |
2011 |
2012 |
2013 |
2014 |
2015 |
2016 |
2017 |
2018 |
|
Customer base1 (in lakhs) |
2.5 |
26 |
96 |
225 |
347 |
421 |
457 |
473 |
|
Annual revenues1 (in Crs) |
50 |
217 |
2000 |
3542 |
4324 |
4598 |
4681 |
4705 |
|
Annual revenue per user (in Rs) |
2,000 |
835 |
2,083 |
2,083 |
2,083 |
2,083 |
2,083 |
2,083 |
|
Growth in customer base2 |
940% |
269% |
134.6% |
53.8% |
21.5% |
8.6% |
3.4% |
|
|
User growth from 2013 to 2015 |
|
|
|
|
260.9% |
|
|
|
1 Source: ET article on Flipkart dated 13th Oct, 2013 2. Expectations of the Analyst
B. Valuation multiples for Flipkart
|
Company |
EV/Sales |
EV/EBITDA |
|
Mercadolibre |
11.54 |
31.09 |
|
eBay Inc |
4.50 |
15.38 |
|
Rakuten Inc |
2.87 |
12.55 |
|
B2W |
0.90 |
16.99 |
|
Alibaba.com |
8.23 |
25.66 |
|
Amazon.com |
2.88 |
69.42 |
|
DangDang |
0.65 |
NA |
|
CDON Group |
0.70 |
NA |
|
buch.de |
0.72 |
41.37 |
|
Median |
0.71 |
25.66 |
2 Source: Financials taken from Google Finance, Yahoo Finance
C. Valuation multiples for Redbus
|
Company |
EV/Sales |
EV/EBITDA |
|
Travelzoo |
1.62 |
7.87 |
|
Wotif.com |
2.77 |
4.90 |
|
Ctrip.com |
8.03 |
44.33 |
|
eLong.com |
2.65 |
NA |
|
Orbitz Worldwide |
1.39 |
8.38 |
|
Expedia.com |
2.14 |
13.72 |
|
Hotel.de |
2.32 |
65.93 |
|
Priceline.com |
10.83 |
30.08 |
|
Tomorrow Focus AG |
1.74 |
12.10 |
|
Makemytrip.com |
2.75 |
NA |
|
Median |
2.48 |
12.91 |
Source: Financials taken from Google Finance, Yahoo Finance